CARSON CITY
As I write this, I’ve already been hearing President-elect Donald Trump being compared with multiple presidents.
There’s Andrew Jackson (populist), Richard Nixon (appealing to the “silent majority”) Jimmy Carter (Washington outsider), Ronald Reagan (change-agent).
I’ll let historians sort that out way down the road.
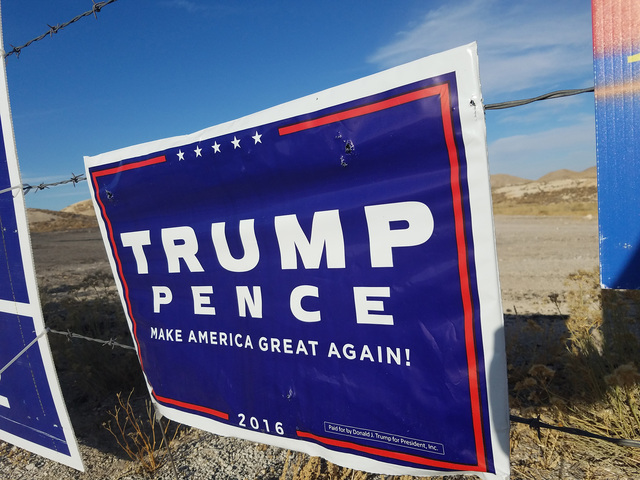
What about Trump in Nye County?
He crushed Hillary Clinton, gaining about 68 percent of the Nye County vote compared to Democrat Clinton’s 26 percent on Nov. 8.
In the past 56 years, Trump’s 68 percent figure trails only Ronald Reagan, who gained 72 percent of the Nye County vote in 1984.
A few weeks before the election, I was curious about Nye County’s voting history, how it might compare to this year and anything that stands out. So I visited the Nevada State Library and Archives in Carson City.
It was supposed to be only a one-day visit, but the archives are still dealing with budget cuts from the recession and have limited hours. That meant it took two days to find the data.
I went all the way back to the 1960 election between Republican Richard Nixon and Democrat John Kennedy to see now Nye County residents had voted. I consulted official records plus reference books, including multiple editions of “America Votes.”
Some highlights I came up after studying the numbers from 1960-2016 for Nye County:
■ In 15 presidential elections between Nixon-Kennedy and Trump-Clinton, Nye has supported the person who ended up in the White House 11 times.
■ From 1960-88, Nye County voted for the winning candidate eight straight times.
■ But from 1992-2016, Nye County’s record is 3-4 in selecting the candidate who ended up in the White House.
■ Nye voters have backed Democrats in the past, including Kennedy in 1960, Lyndon Johnson in 1964 and Jimmy Carter in 1976, but it’s been decades since that happened.
■ Nye has not voted for a Democrat for president since Carter in 1976, an 0-10 streak from Democrats, dating back to 1980.
■ Nye has been competitive for third-party candidates, including George Wallace in 1968 and Ross Perot in 1992 and 1996. Both finished behind the Republican and Democratic nominees those years but received sizable percentages of the vote.
■ Nye voted against sitting presidents three times: Carter in 1980, Bill Clinton in 1996 and Barack Obama in 2012.
■ The biggest drop from election to election in Nye involved Carter. He gained about 52 percent of the vote in 1976 but reached only half of that, 26 percent, in 1980 against Reagan.
■ Carter is the only candidate between 1960-2016 who won Nye County’s vote in one election (1976) but lost it four years later (1980).
■ When it comes to supporting vice presidents or former vice presidents later seeking the presidency, Nye County is 5-4. It supported Nixon (twice), Johnson and George H.W. Bush (twice), all Republicans, but rejected Hubert Humphrey, Gerald Ford, Walter Mondale and Al Gore in their presidential runs.
■ When it comes to national landslides, Nye has always backed the winner: Johnson in 1964, Nixon in 1972 and Reagan in 1984.
■ And when it comes to Nye County’s overall population, that has grown from 4,374 in 1960 to 43,946 in 2010 (the most recent full U.S. census).
Here’s the Nye County presidential breakdown through the years.
The popular vote percentages are rounded up with results including only the Democratic and Republican nominees except for 1968, 1992 and 1996 when third party candidates made strong showings:
1960
John Kennedy (D): 57 percent
Richard Nixon (R): 44 percent
1964
Lyndon Johnson (D): 61 percent
Barry Goldwater (R): 39 percent
1968
Nixon (R): 41 percent
Hubert Humphrey (D): 35 percent
George Wallace (American Independent): 24.1 percent
1972
Nixon (R): 62 percent
George McGovern (D): 38 percent
1976
Jimmy Carter (D): 52 percent
Gerald Ford (R): 43 percent
1980:
Ronald Reagan (R): 64 percent
Carter (D): 26 percent
1984
Reagan (R): 72 percent
Walter Mondale (D): 25 percent
1988
George H.W. Bush (R): 65 percent
Michael Dukakis (D): 31 percent
1992
Bush (R): 34 percent
Bill Clinton (D): 32 percent
Ross Perot (Reform Party): 31 percent
1996
Bob Dole (R): 43 percent
Clinton (D): 36 percent
Perot (Reform): 17 percent
2000
George W. Bush (R): 57 percent
Al Gore (D): 37 percent
2004
Bush (R): 59 percent
John Kerry (D): 39 percent
2008
John McCain (R): 55 percent
Barack Obama (D): 41 percent
2012
Mitt Romney (R): 60 percent
Obama (D): 36 percent
Contact reporter David Jacobs at djacobs@tonopahtimes.com