While Nye County awaits final results from Tuesday’s primary, here are a few stats:
■In Nye County, there were 31,499 voters eligible to vote in the primary election.
■ Republicans comprise the largest population of active voters; they make up 45.8% of voters, there are 14,437 voters.
■ Non-partisan voters make up 27.85% registered voters in Nye County, with 8,774 voters.
■ Democrats make up 18% of registered voters in Nye County, with 5,699 voters.
■ 2,343 Nye County residents voted early this year.
■ The Nye County Clerk’s office has 10 days after the election to give a final count to the commissioners.
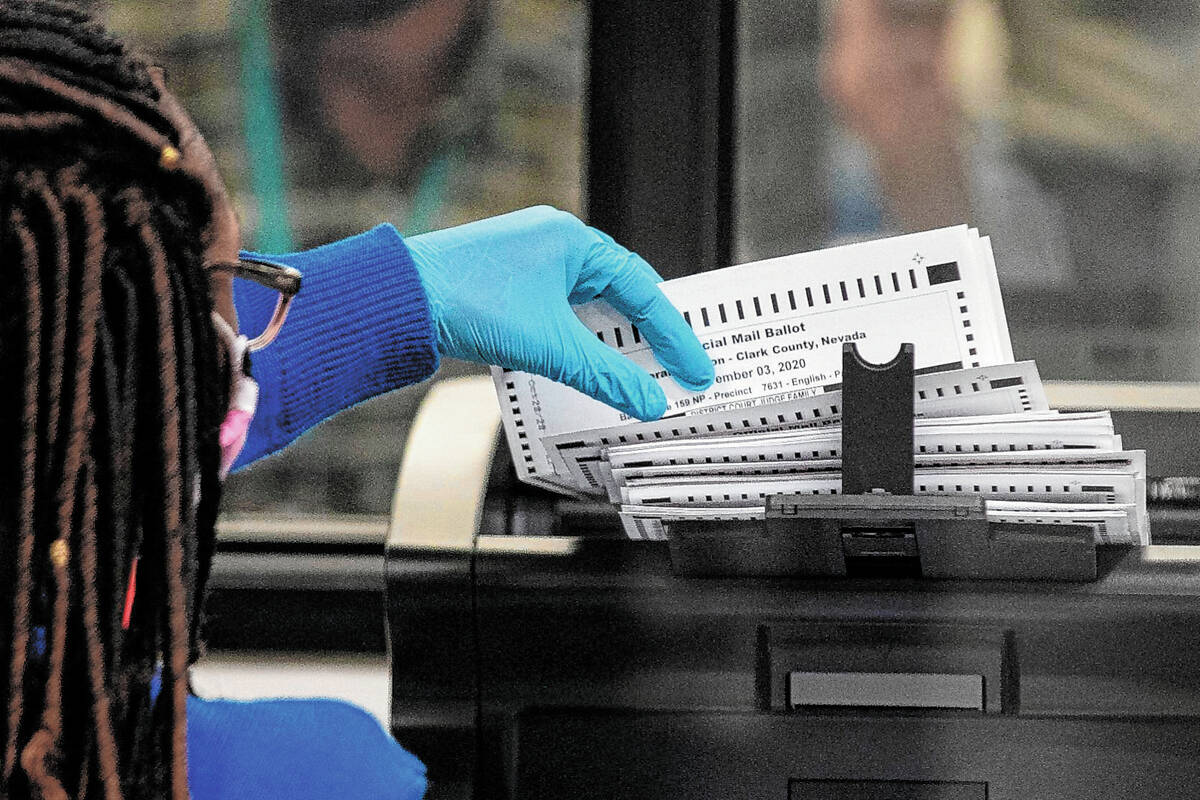
■ In the 2020 primary election, roughly 36% of eligible voters cast their ballot in Nye County — a larger amount of voters than the 2018 primary. The 2020 general election brought double the amount of voters, where more than 50% were mail-in ballots. Over three-fourths of those who voted in-person in Nye County chose to by early voting.
■ In Nevada there are 1.82 million active voters. Clark County has more Democrat voters than Republicans and makes up 70% of voters in Nevada, followed by Washoe County that makes up 17% of all votes and they are now at a near split between Democrat and Republican voters. Nye County makes up less than 2% of statewide votes.
Sources: Silver State Election Results, Nevada Secretary of State, Nye County Elections